Central Florida Real Estate Market
While the data above reflects national trends, what’s happening in our Central Florida Real Estate Market?
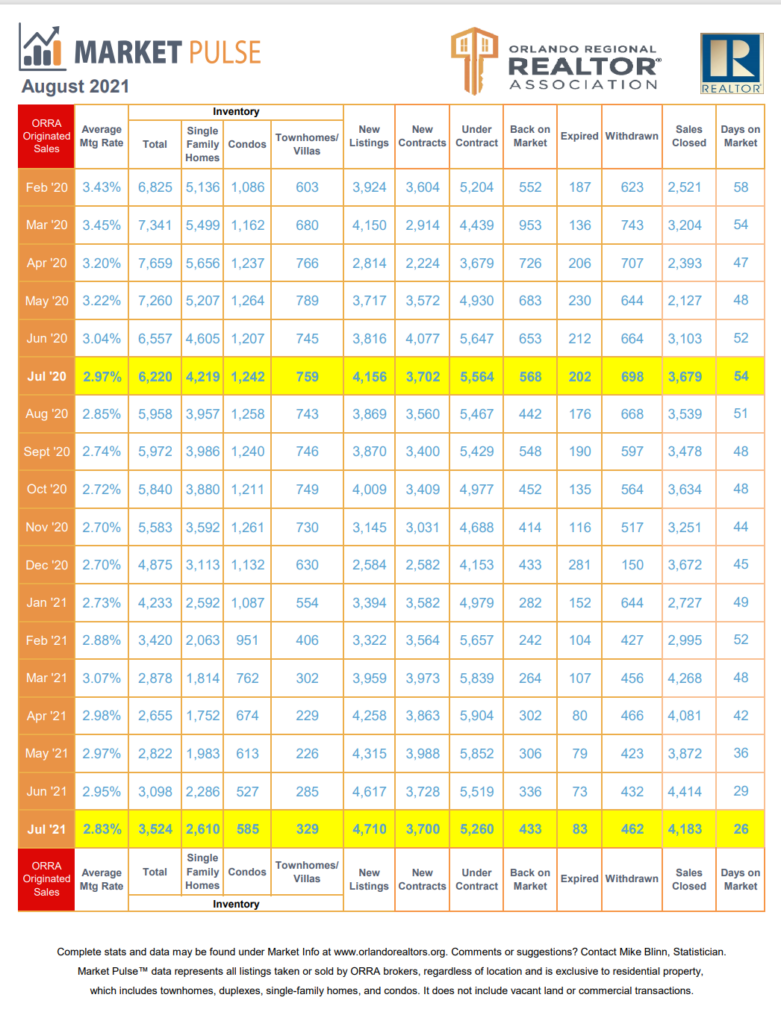
Every month the Orlando Regional Realtor Association puts out a Market Pulse article. This publication shows us Realtors what’s happening with pricing, inventory, and mortgage rates. It is a very effective way to get a quick visual of what’s happening in the Central Florida Real Estate Market.
I’ll share some of the data with you that was published in the August release. This shows data through July, 2021.
The Monthly Mortgage Rate
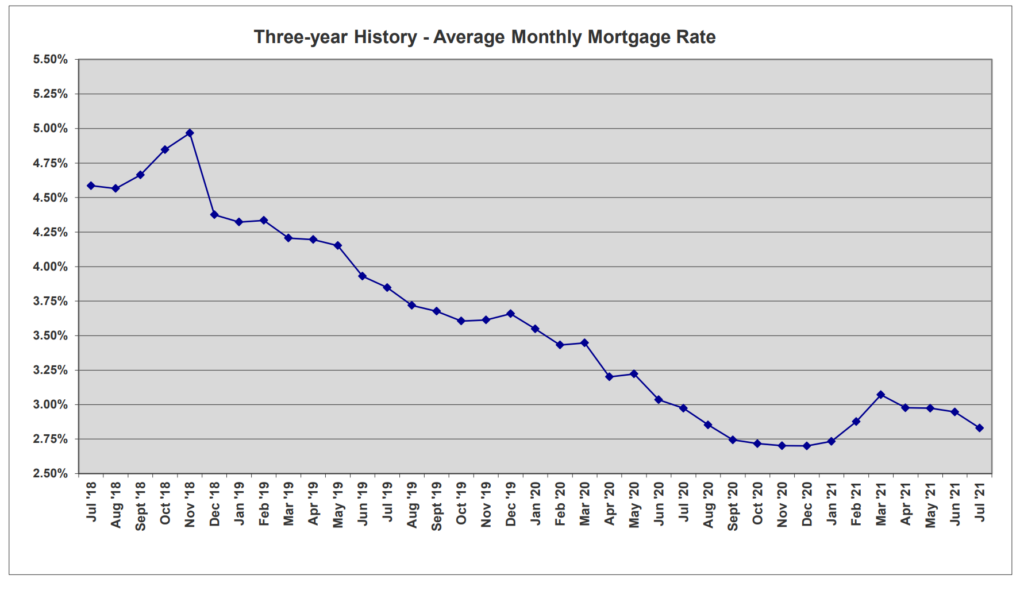
This chart from the Orlando Regional Realtor Association shows the mortgage rate over the past 3 years. It’s important to view this data because fluctuations in the mortgage rate will affect how many people can afford to buy a home.
New Listings and Inventory in the Central Florida Real Estate Market
This chart shows the number of new listings coming on the market over time:
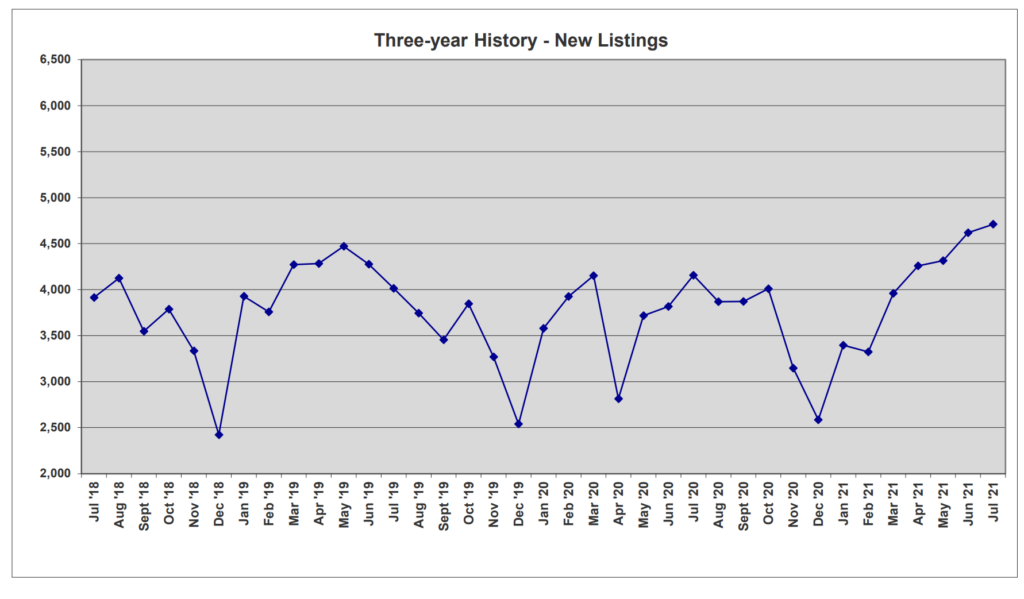
You can clearly see that there’s a dip every December. This makes sense as most people are home for the holidays, or traveling to visit with family, and it’s the time when people usually don’t want to list their home for sale.
Similarly, April has traditionally been the month where we see most new listings, in preparation for our typically busy Spring market. But take a look at April 2020. You can see that home listings dropped as we dealt with Covid shutdowns and fear of having strangers come through our homes.
You can see this has started to change as wel look at 2021, and the number of new listings in the Central Florida Real Estate Market is rising again.
But this is the chart that I like to view more, it shows the total inventory over time.
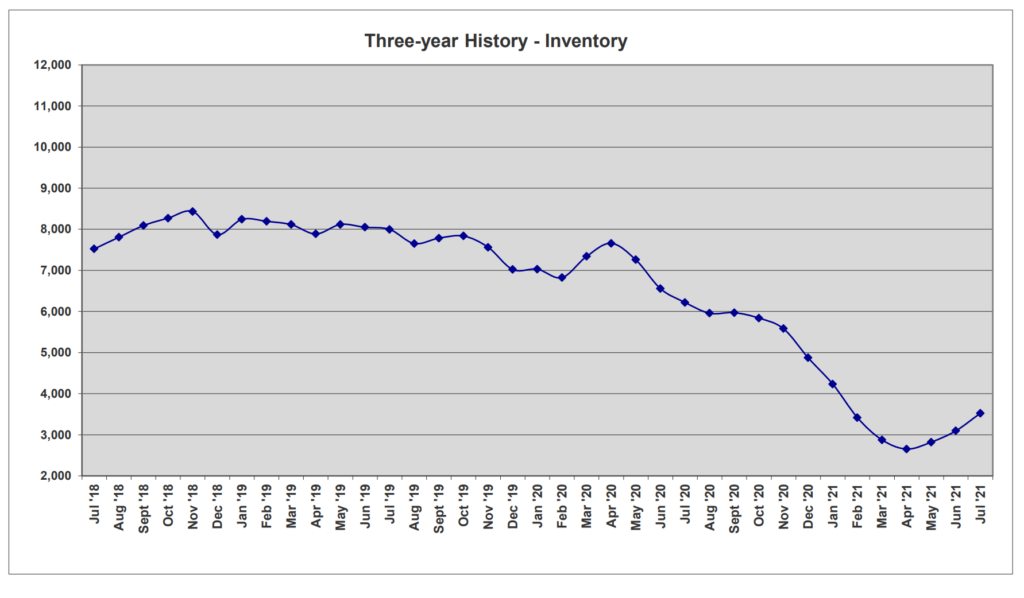
This chart, above, shows total inventory. Whereas the prior chart showed us new listings only, this shows us what’s available for buyers searching for homes.
If you look at April, 2020 on this chart, you’ll see a spike in inventory. The reason for this is again due to Covid. While the world shut down to slow the spread, homes were being shown less (or not at all) and inventory rose a bit as these homes sat on the market and a few others came up for sale.
The lowest point in inventory came in April of this year. Spring is typically our busiest season, and this year was no exception. Homes were in severe demand and commanding prices and terms that we’ve never seen before. Many homeowners were prevented from buying due to this lack of inventory and incredible competition.
The good news seems to be that, as of July, 2021, the total inventory has bumped up a bit. If this trend continues, we will see a cooling off in the crazy competition we’ve been seeing and the Fall market will be a bit easier for home buyers.
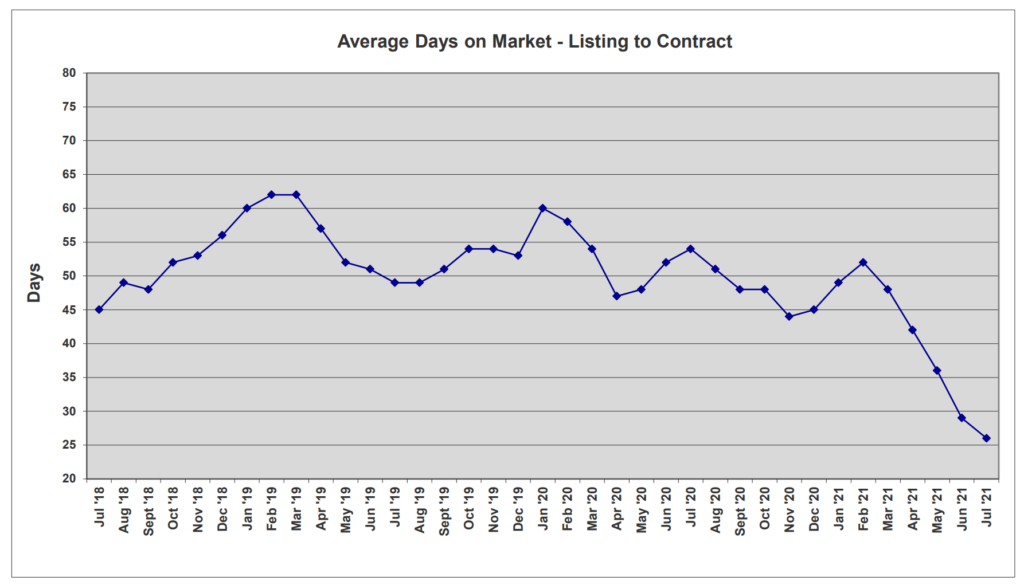
Can I take my time to search for a home?
No! Definitely not. The great homes are still selling very quickly, as you can see from this chart. So be ready, get prequalified, find a great Realtor (I’m available if you need me), and make a strong competitive offer.
If you’d like some booklets with tips on buying and selling, you can download them free from my Resource Library.
Also, if you find yourself looking for ways to beat out the competition, you can read my article on how to use an escalation clause to win the bid.
The Summary Sheet for the Central Florida Real Estate Market